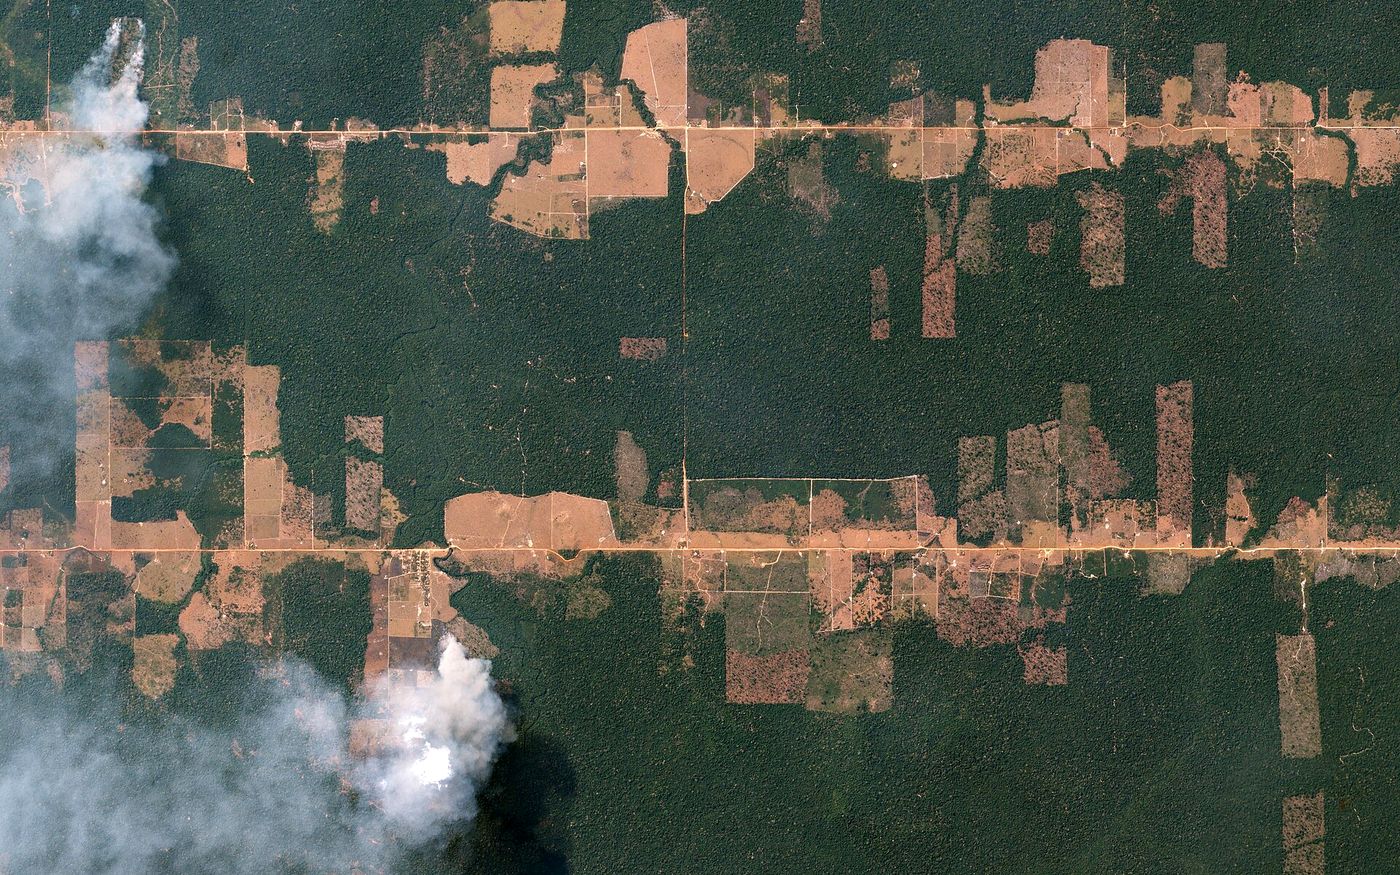
Change detection
Two or more dates compared and every difference mapped: new buildings, cleared land, moved earth.
Home/Analytics
Our geospatial team turns imagery into measurements and maps you can act on, delivered as GIS layers and a plain-language report.
Two or more dates compared and every difference mapped: new buildings, cleared land, moved earth.
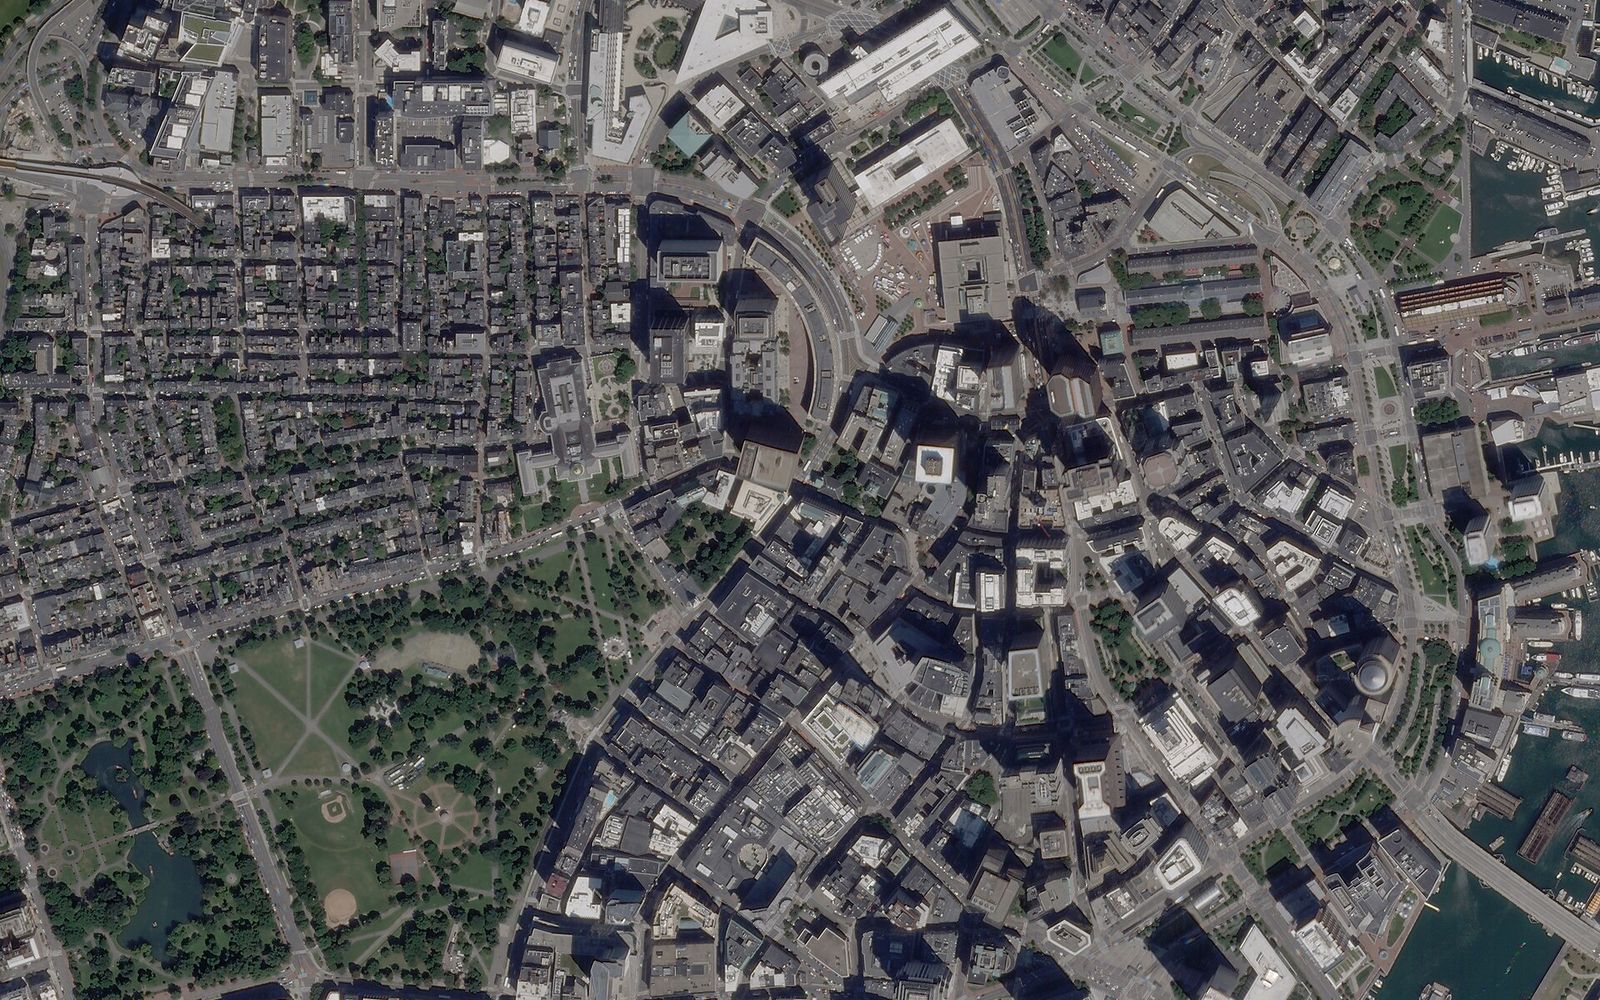
Vehicles, ships, aircraft, containers and buildings counted and located across a site.
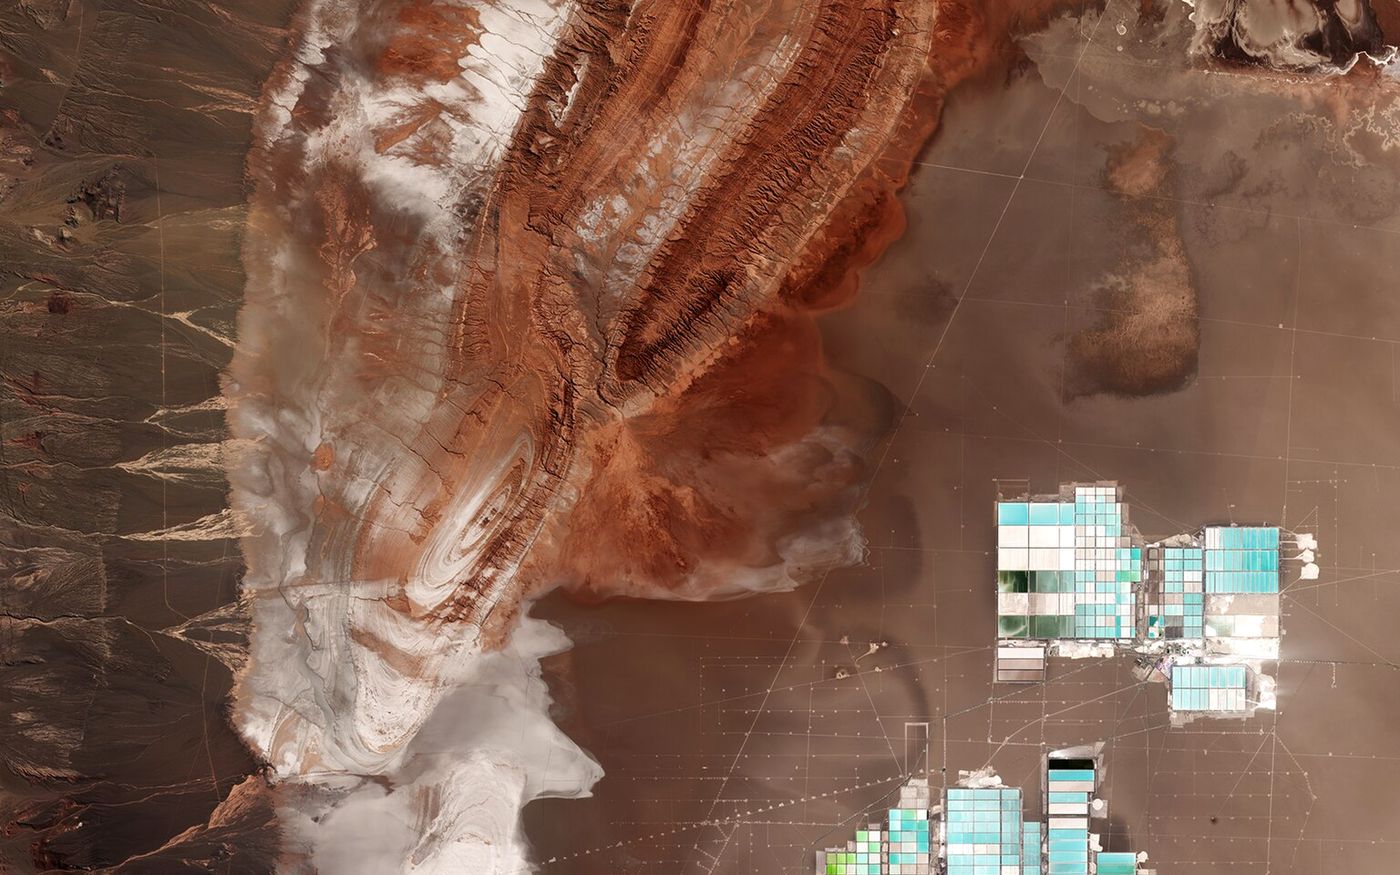
Heaps, pits and dumps measured from elevation models, date after date.
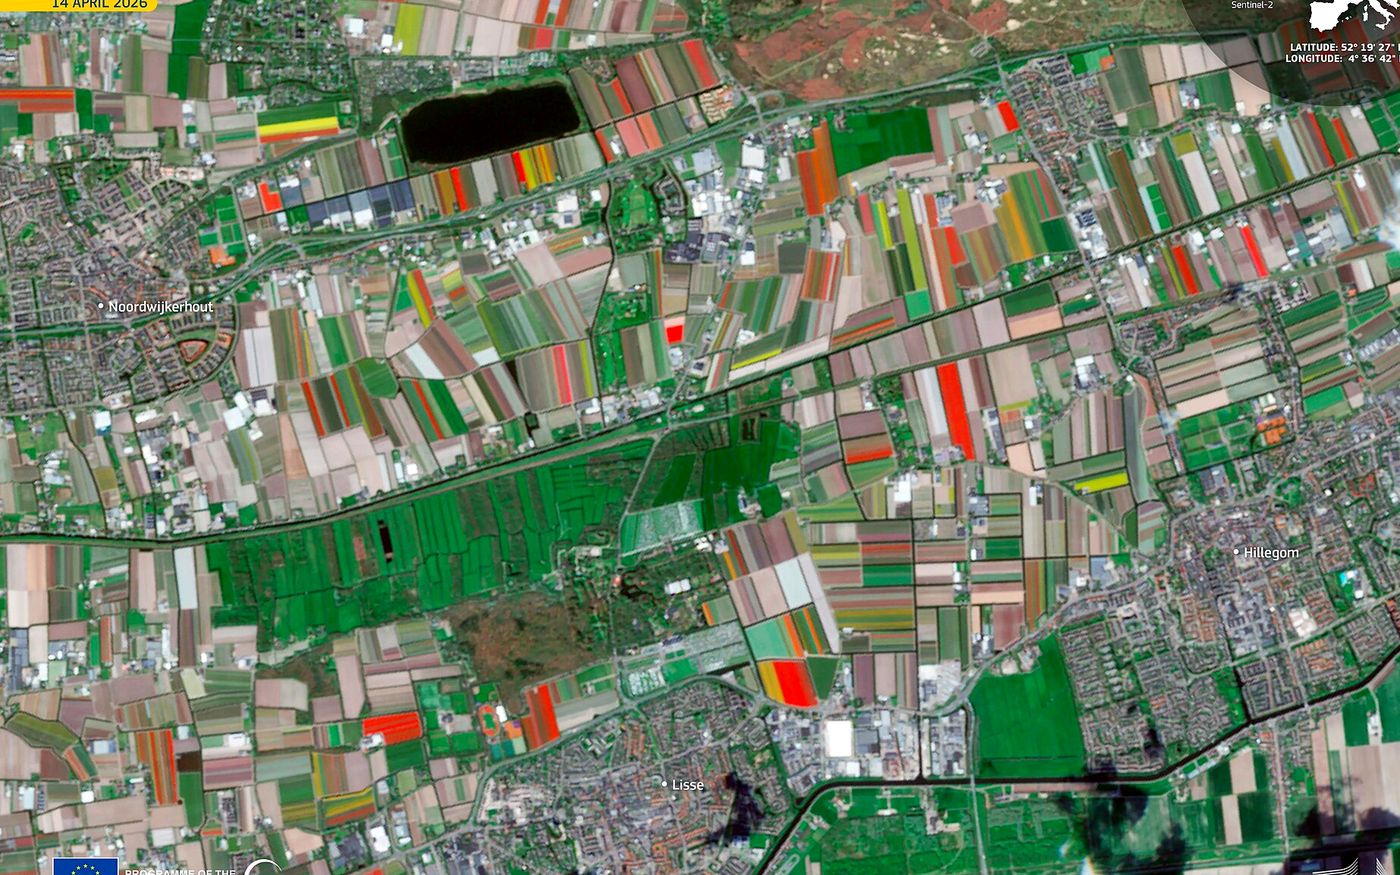
Vegetation indices, crop type and area, field by field, through the season.
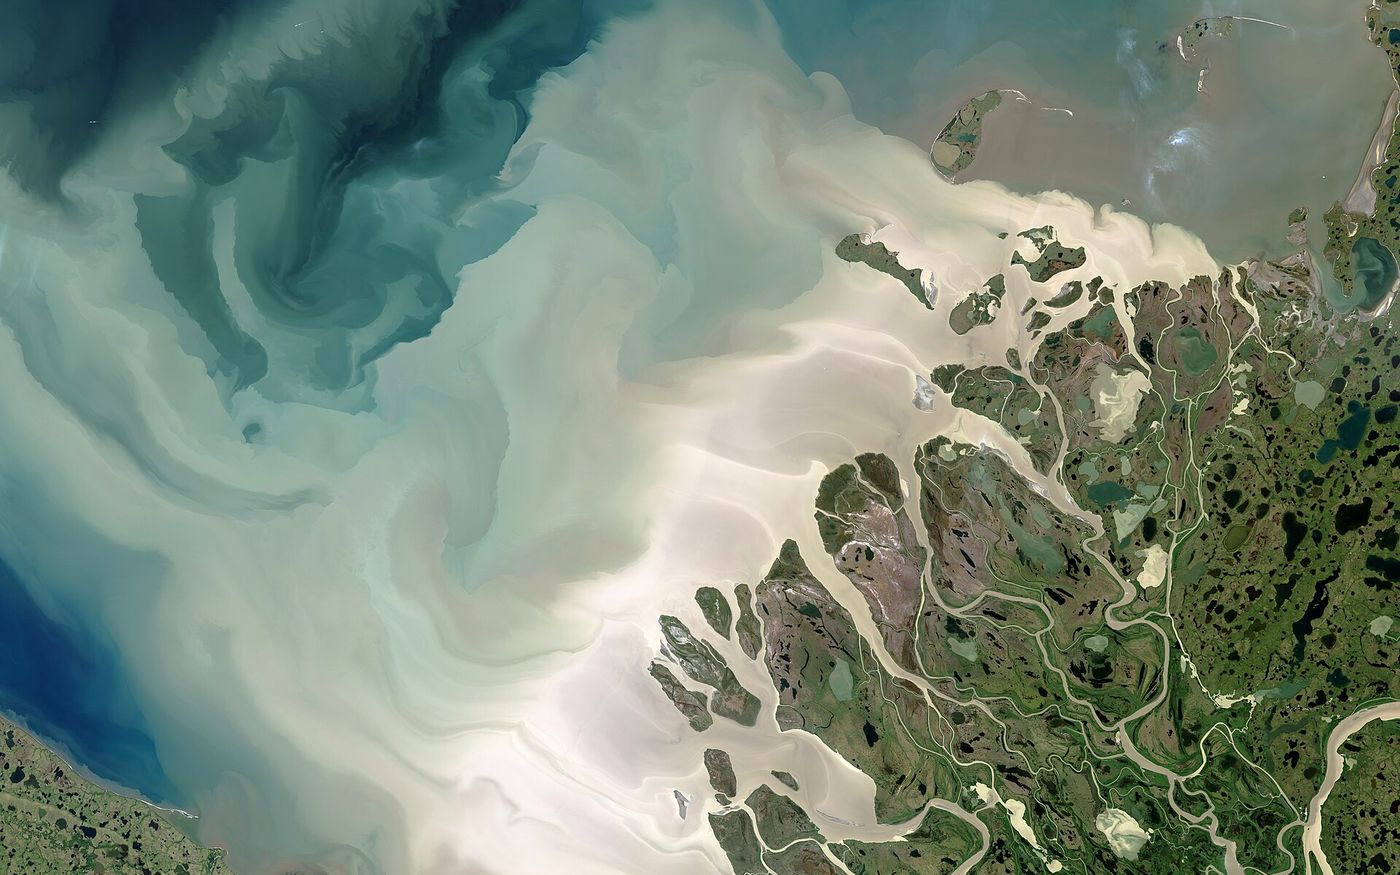
Flood extent from radar, shorelines, reservoirs and water quality.
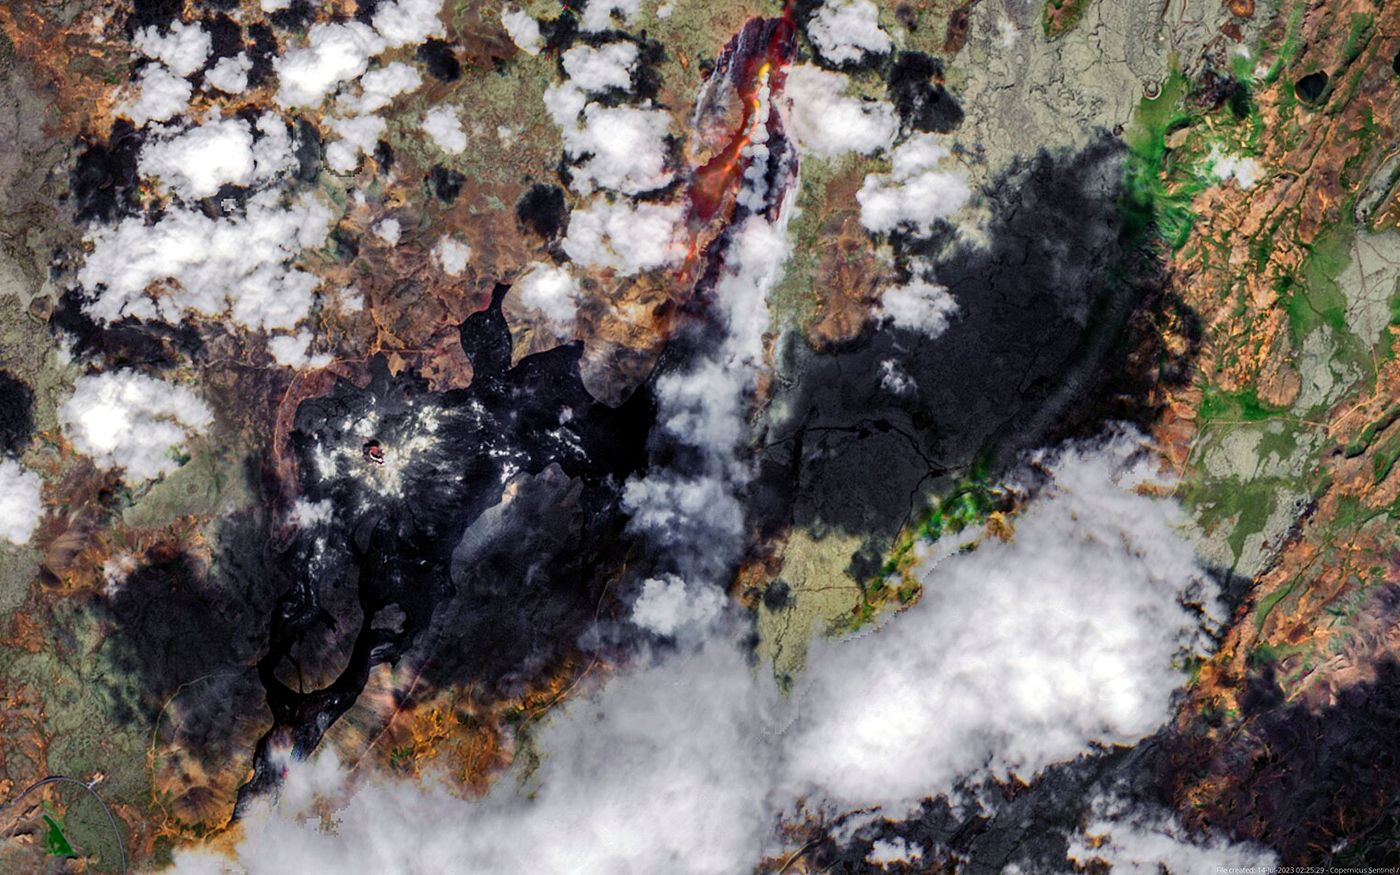
Millimetre-scale subsidence and uplift from repeated radar passes, for dams, mines and cities.
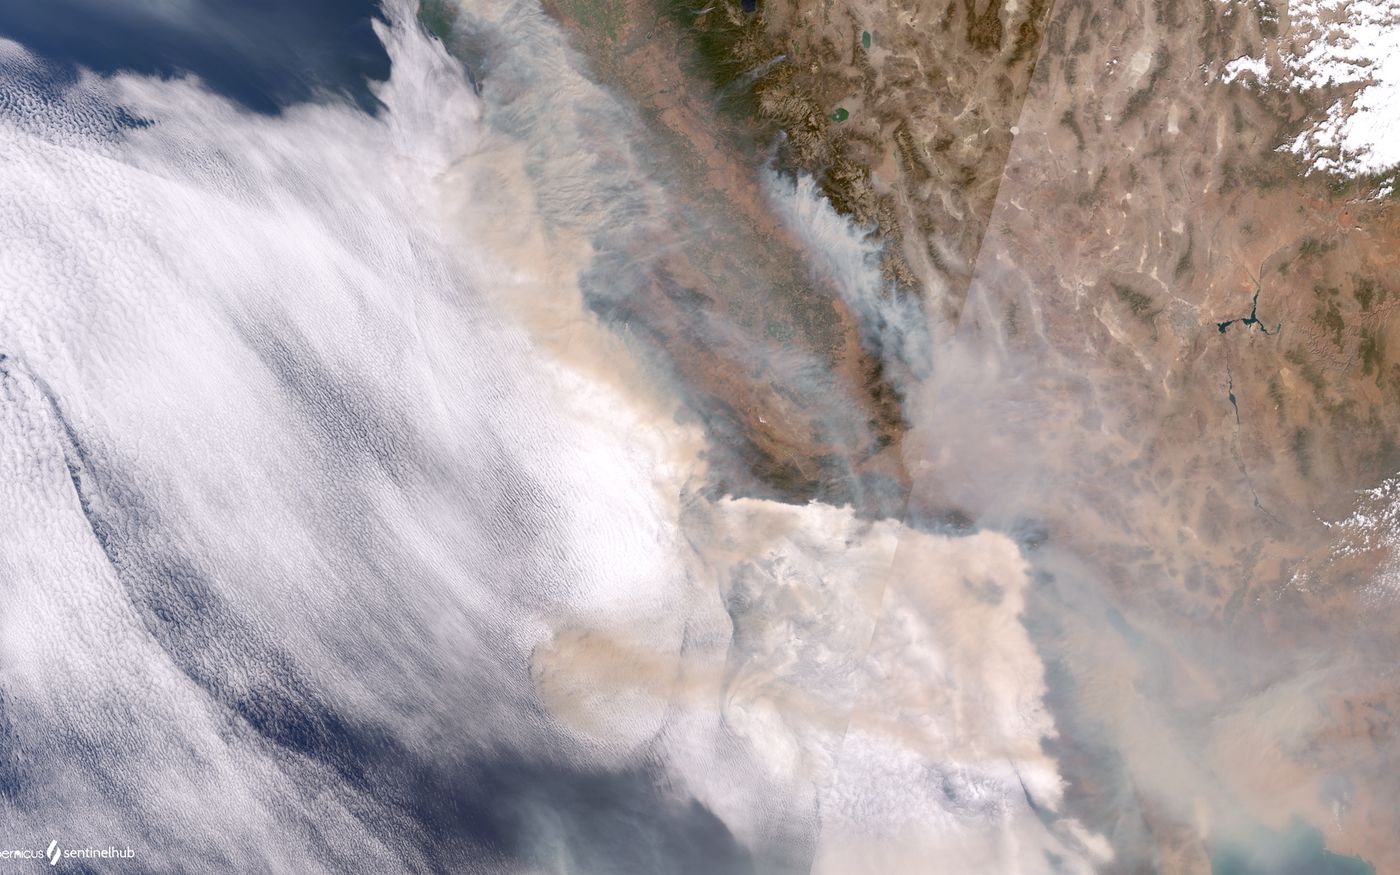
Burn scars, damaged buildings and blocked roads, assessed soon after the event.
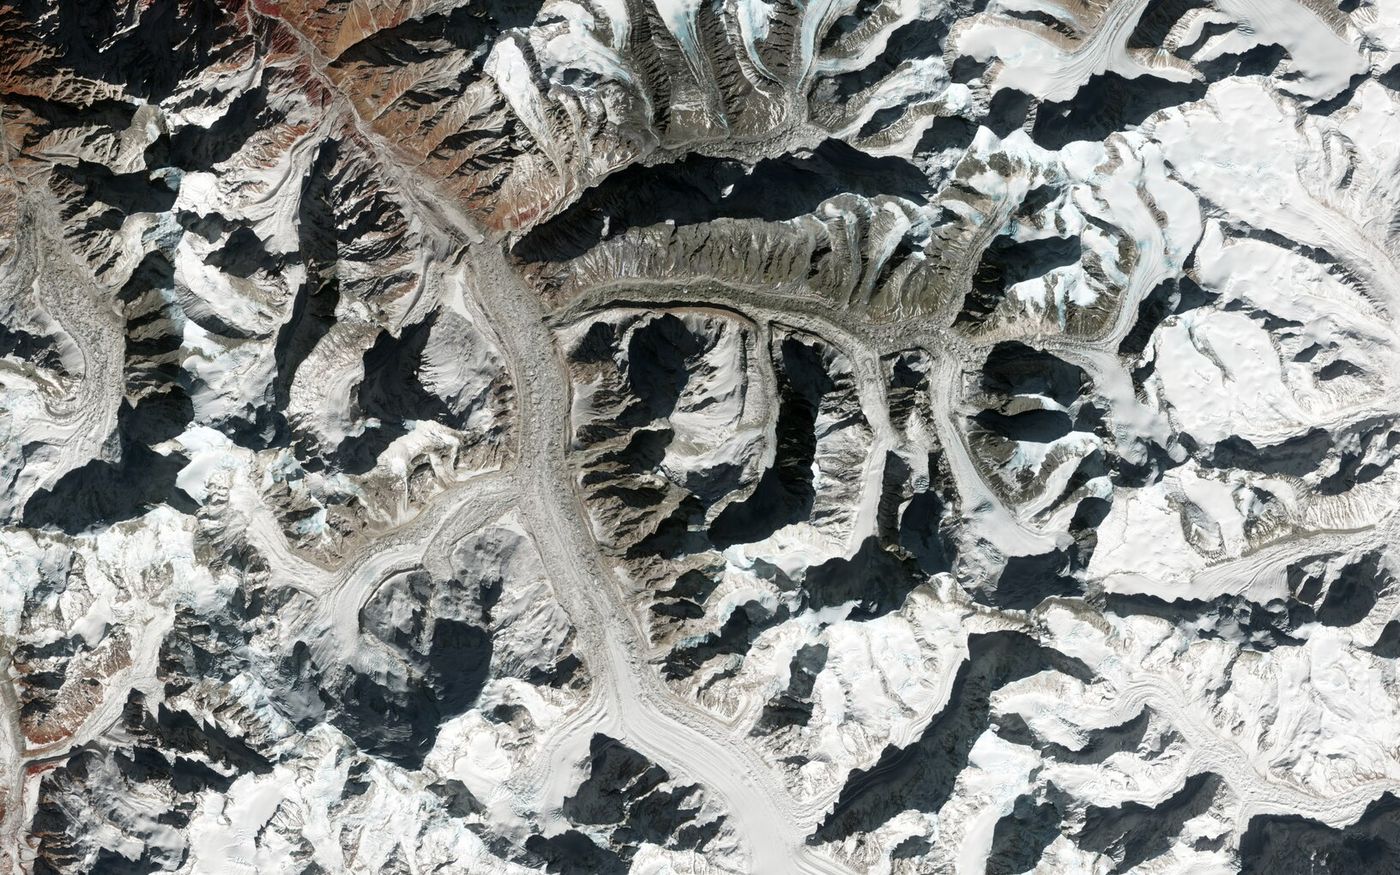
Digital surface and terrain models, contours and 3D city models.
The picture people recognise: roads, roofs, ships and shorelines in true colour.
Bands beyond human sight separate healthy crops, bare soil, water and burn scars.
Works at night and through cloud, and picks out metal, ships and flooded ground.
Height for every pixel, so we can measure volumes, slopes and flood risk.
The layers combined into outlines and counts you can drop straight into your GIS.
Illustration styled from one Sentinel-2 scene of Rotterdam. Only the optical plate is imagery as captured.
Tell us the site, the dates and what you need to know.
We choose the sensors, archive or tasking, and confirm the price.
Our team processes, measures and checks every result.
GIS layers, a report, and imagery you can show others.
Archive search, new captures and your orders are all in the portal.
Can't find what you need? Ask for a quote